The MSW TBSM tracking service measures brand preference as one component of the survey. We collected Brand Preference data for the Casual Dining Restaurant category in both 2019 and 2023. Included in this competitive set is Red Lobster, which recently declared bankruptcy. This week’s MSW Research Chart of the Week looks at both Brand Preference and business results for Red Lobster over this time period.

- Many news stories have pointed to the brand’s Endless Shrimp promotion as the reason for the financial trouble leading to Red Lobster seeking bankruptcy protection. Per Newsweek, third quarter company losses of $11 million were “largely attributed to the deal”, due to both the enthusiasm of those partaking in the offer and an unfortunate rise in shrimp prices.
- Other stories blame the real estate sale and leaseback scheme perpetrated by the brand’s previous owners, the private equity firm Golden Gate Capital. This is said to have led to above market rate leases at many Red Lobster properties.
- Both these explanations imply the bankruptcy was due to cost issues. But the evidence suggests there is more to the story.
Our first chart shows that Red Lobster never completely recovered from the carnage inflicted on the Casual Dining Restaurant segment by the COVID 19 pandemic.
- Per data from Technomic, Red Lobster sales revenue in 2022 was still $130 million below the corresponding 2019 pre-COVID figure, despite high rates of inflation (with attendant price increases that would tend to raise revenue even with comparable business activity).
- As a point of reference, Casual Dining competitor Applebee’s realized $290 million more revenue in 2022 versus 2019 and saw continued gains in 2023 (as reported by Statista).
While Red Lobster revenue for 2023 does not appear to be available, other telling information has been reported.
- A document from current CEO Jonathan Tibus indicates that the chain suffered a loss of $76 million during 2023, which dwarfs the $11 million loss attributed to the Endless Shrimp promotion.
- The document further states that Red Lobster has suffered a 30% drop in foot traffic since 2019.
- It is clear, then, that there is more than costs underlying the fall into bankruptcy by this venerable seafood chain which was initially founded in 1968.
This brings us to our second chart, which shows that brand preference for Red Lobster has declined significantly since 2019. Brand preference reflects the strength of the position a brand holds in consumers’ hearts and minds and has been shown to accurately predict market share in numerous studies. Brand preference summarizes a multitude of factors influencing consumer perceptions of a brand – such as value, quality, variety, convenience, service, experience – into one highly predictive metric.
- The large drop in brand preference since 2019 indicates a deterioration of the brand’s perception among consumers. This is reflected in Red Lobster’s tepid sales performance and large decline in guest numbers. While costs are important, the brand’s issues appear to run much deeper than a poorly conceived sales promotion. While a successful exit from bankruptcy may help improve the brand’s cost structure, the slide in brand preference will need to be reversed in order for the brand to return to consistent growth and profitability. This will require much more work than even a successful gimmicky promotion.
The MSW TBSM tracking service measures Brand Preference as one component of the survey. Wireless Phone Service category, changes in Brand Preference levels between March 2023 and March 2024 were computed for individual brands. Our Chart of the Week displays these results for the three top players in the U.S. Wireless Phone Service market: AT&T, T-Mobile and Verizon.
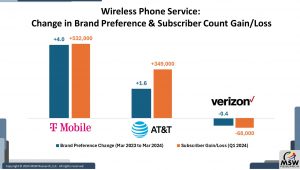
In addition to Brand Preference data, this week’s chart includes the absolute number of subscribers gained or lost in Q1 of 2024 for each of the top competitors as reported by each company.
- Brand Preference was read among Wireless Phone Service Users in both March of 2023 (N=492) and March of 2024 (N=494).
- Based on this sample of category users, Brand Preference surged higher for T-Mobile (+4.0%), was moderately higher for AT&T (+1.6%) and declined slightly for Verizon (-0.4%).
- These changes in Brand Preference levels are consistent with recent subscriber growth (or loss) levels.
- Bloomberg has reported that “In recent years, Verizon has lost ground in subscriber growth to wireless rivals”.
- This trend continued in Q1 of 2024, as it has been reported that T-Mobile added over half a million subscribers; AT&T added nearly 350 thousand subscribers; and Verizon lost close to 70 thousand subscribers.
- One potential reason for the strengthening of Brand Preference for T-Mobile comes from the fact that the brand draws substantially more of its preference (compared to AT&T and Verizon) from those who cite “has a low monthly bill” as the most important category characteristic. This characteristic is not only cited most often among category users in the TBSM survey as being most important, but also gained the most support over the past year versus all other category characteristics included in the survey.
The MSW TBSM tracking service measures brand preference as one component of the survey. Using TBSM Auto Insurance category data, changes in brand preference results between 2021 and 2023 were computed for individual brands. Our Chart of the Week displays these results for the three top players in the US Auto Insurance market: State Farm, Geico and Progressive.
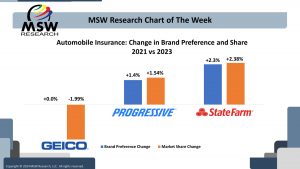
In addition to this brand preference data, this week’s chart includes the change in market share (between 2021 and 2023) for each of the top competitors as computed from annual published data from the National Association of Insurance Commissioners.
- Between 2021 and 2023, State Farm realized gains in both brand preference and market share of over two percentage points.
- Similarly, Progressive also achieved increases in both brand preference and market share of around one and a half percentage points.
- For Geico, brand preference was flat while market share decreased close to two percentage points.
- Brand preference for State Farm and Progressive tracked market share very closely. This is expected given previous studies which demonstrate the close relationship between preference and market share. In fact, independent studies conducted by the Marketing Accountability Standards Board (MASB) have found that preference proved to be a better fit to sales and market share than any other standard research question examined.
- Geico experienced less favorable market share results than might be expected from the unchanged level of brand preference. There are two reasons for this: price and level of advertising spend.
- The MASB research also demonstrated that including price along with brand preference provides an even better prediction of market share. These studies demonstrated that an increase in brand preference can translate into either a gain in market share or the ability to charge a price premium at the same market share level.
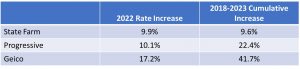
- According to data from S&P Global, over the time period from 2018 through 2023, Geico’s rates increased substantially more than their competitors. And in 2022, the year where all insurers started making large increases in rates due to increased losses due to inflation and other post-pandemic factors, Geico increased rates much more than State Farm or Progressive:
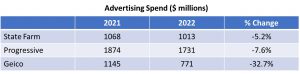
- Due to the same profitability issues, automobile insurance companies also cut back on advertising spend starting in 2022. While 2023 figures are not yet available, a report from AM best showed that Geico cut back on advertising spend much more than did either State Farm or Geico:
- The combination of a much larger increase in rates and much larger cut back in advertising spend explain why Geico experienced a drop in market share between 2021 and 2023 despite an unchanged level of brand preference.